When we think of technical documentation, we often picture walls of text: step-by-step instructions, safety warnings, and compliance notes. But our recent deep dive across industrial, consumer automotive, and electronics documentation tells a different story:
Visuals — diagrams, screenshots, schematics, tables — carry a third to half of the knowledge that users actually rely on.
That insight changes how we think about building AI-driven support tools for engineers, technicians, and even drivers.
A Tale of Three Manuals
We analyzed three very different kinds of documentation — and found a surprisingly consistent pattern.
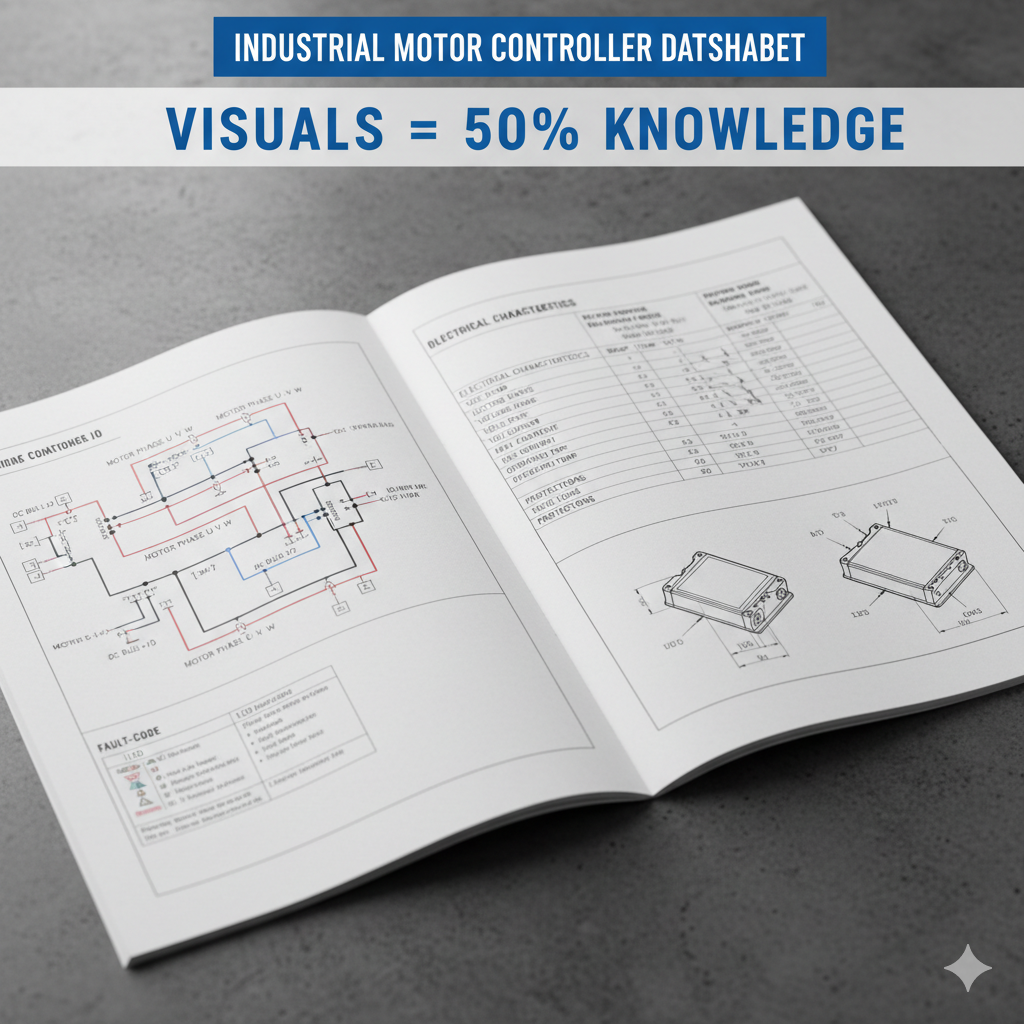
Industrial Motor Controller Datasheet
(Example: a brushless DC motor controller)
Pages full of wiring diagrams, connector pinouts, LED/fault charts, and mechanical drawings. Heavy use of tables for specs and tolerances. On key pages, diagrams occupied 50–60% of the page area.
≈45–50% of actionable knowledge lives in visuals.
Gardening Equipment Manuals
(Example: turf aerators and soil-management machines)
Setup & assembly sections: up to 65% visuals — exploded views and annotated diagrams.
Maintenance & troubleshooting: about 35–50% visuals — lubrication charts, torque tables.
Safety instructions: mainly text, but still 20–30% visuals for warning symbols.

Tesla Owner’s Manual
Touchscreen & driving features: 45–55% visuals — screenshots of the UI, steering-wheel stalks, button locations.
Maintenance & troubleshooting: 35–45% visuals — diagrams for jack points, fuse boxes, wipers.
Safety & legal sections: largely text-based (10–15% visuals).

Why Visuals Matter
Visuals aren’t just decoration. They:
- Show spatial and structural relationships that text can’t easily describe.
- Speed up troubleshooting, e.g., linking a flashing LED pattern to a fault table or showing a touchscreen button’s location.
- Reduce ambiguity, especially in multilingual contexts — diagrams often “speak” more clearly than words.
- Anchor procedural steps, letting users “follow the picture” instead of parsing dense text.

Implications for AI Knowledge Tools
Most AI and search tools still focus on text-only retrieval, leaving out the visuals. But in all three domains we studied, ignoring visuals means losing 30–50% of the knowledge users need to act on.
Next-generation operational AI should:
- Ingest and index visuals alongside text — diagrams, screenshots, tables.Retrieve and highlight both text and visuals when answering a query.
- Point to the exact figure or screenshot relevant to the question.
- Imagine asking:“How do I enable Sentry Mode?”…and the AI shows not just the steps, but highlights the button on the actual touchscreen image.
Closing Thoughts
Whether it’s an industrial datasheet, a gardening machine’s service manual, or a Tesla Owner’s Manual, we found that visuals consistently carry a third to half of the actionable information. For AI-driven knowledge systems to truly help technicians, engineers, and drivers, they must become visually literate — delivering not just the right words, but also the diagrams, schematics, screenshots, and tables that drive real-world action.
